What Core Web Vitals measure, and what fixing LCP on my own site taught me
The three Core Web Vitals and their thresholds, why lab scores are not the assessment, and a real Largest Contentful Paint investigation on this website.
 Parsa Alizadeh
4 min read
On this page
Core Web Vitals are three metrics Google uses to describe how a page feels to real people: how fast the main content appears, how quickly the page responds, and how stable the layout is. This post covers what each one measures, how they are assessed, and what happened when I measured the home page of this site.
The three metrics#
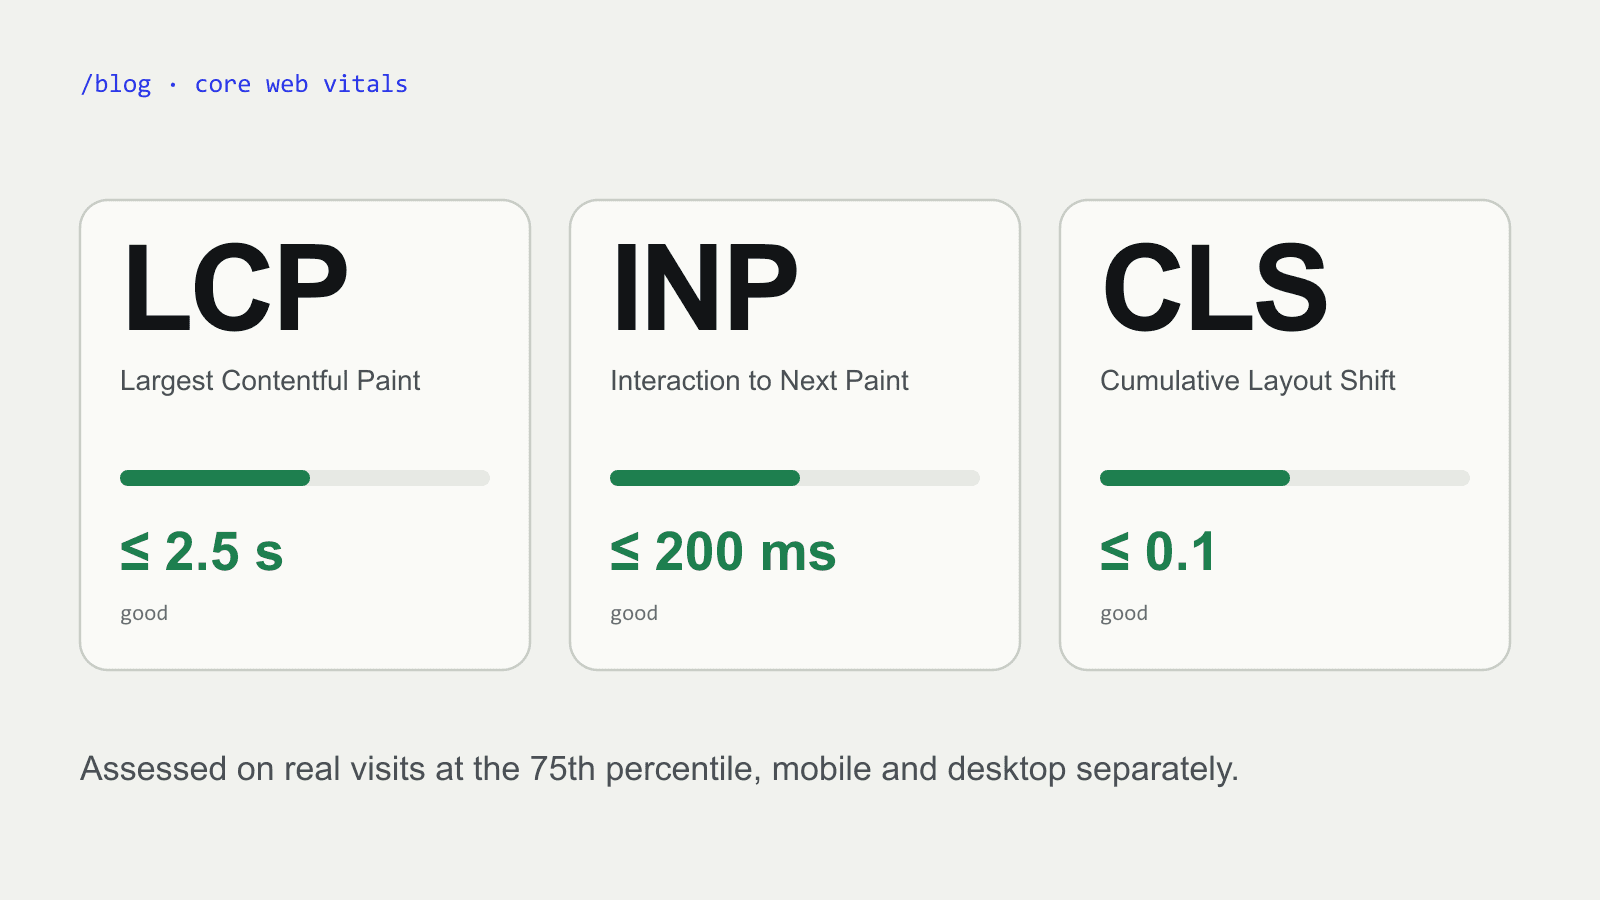
According to web.dev, a page has a good experience when it meets these thresholds [1]:
| Metric | What it measures | Good |
|---|---|---|
| Largest Contentful Paint (LCP) | When the largest visible content element is rendered | 2.5 seconds or less |
| Interaction to Next Paint (INP) | How quickly the page responds to interactions | 200 milliseconds or less |
| Cumulative Layout Shift (CLS) | How much visible content moves unexpectedly | 0.1 or less |
INP is the newest of the three. It officially replaced First Input Delay (FID) as a Core Web Vital on March 12, 2024 [2].
Lab scores are not the assessment#
The thresholds are assessed at the 75th percentile of page loads, segmented across mobile and desktop [1]. That means real visits measured in the field, not one run on a developer's machine.
Tools like Lighthouse produce lab data: a single simulated load under fixed conditions. Lab data is very useful for finding causes, but it is a different thing from the field data the assessment is based on. I treat Lighthouse as a microscope, not a scoreboard.
What counts as the "largest contentful" element#
LCP considers <img> elements, <image> elements inside <svg>, <video> elements, elements with a CSS background image loaded with url(), and block-level elements that contain text [3]. Browsers also apply heuristics to leave out things people would not see as content, such as elements with an opacity of 0, elements that cover the full viewport, and low-entropy placeholder images [3].
The important consequence: a decorative image can become your LCP element if it is the largest thing on screen.
Where LCP time goes#
web.dev breaks LCP into four sub-parts [4]:
- Time to First Byte: until the browser receives the first byte of the HTML.
- Resource load delay: between that first byte and when the browser starts loading the LCP resource.
- Resource load duration: how long the LCP resource itself takes to load.
- Element render delay: between the resource finishing loading and the element being fully rendered.
Knowing which sub-part is large tells you which fix to reach for. A long load delay points to discovery and priority; a long render delay points to work blocking the main thread.
A real investigation: this website#
When I first ran Lighthouse's mobile audit on the home page of this site, the LCP was 4.6 seconds and the performance score was 70. The LCP element was not my name or my photo. It was a decorative background graphic: an SVG of about 1,400 small circles (around 105 KB) that sits behind the portrait in the hero. It was also lazy-loaded.
That broke a rule web.dev states plainly: never lazy-load the LCP image, because it always adds load delay [4].
What I changed, in order:
- Converted the SVG to WebP. Around 1,400 vector circles are expensive to render; a raster image of the same graphic is about 36–39 KB. LCP moved only slightly, because the graphic was still the LCP element.
- Stopped rendering the decorative graphic on small screens. On a phone it was a faint texture behind the portrait. Hidden with CSS and lazy-loaded, it is never downloaded there. The LCP element became the portrait instead, which is real content.
- Preloaded the portrait. Resource load delay for the LCP image dropped to 0 ms.
After these changes the mobile audit showed a performance score of 82, Total Blocking Time down from 520 ms to 140 ms, and a CLS of 0. On the desktop audit, LCP was 0.8 seconds with a score of 99.
A short checklist#
- Find the LCP element first. It may not be what you expect.
- Never lazy-load it [4]. Consider
fetchpriority="high"for the one image that is likely to be LCP, and do not use it on many resources at once [4]. - Keep decorative elements from becoming LCP candidates on small screens.
- Read the sub-parts before choosing a fix.
- Confirm with field data once the site has real visitors, because that is what the thresholds are assessed on [1].
If you care about how motion affects people as much as how fast it renders, I wrote about that in Motion that respects people.
Sources#
- web.dev, “Web Vitals”, https://web.dev/articles/vitals
- web.dev, “Interaction to Next Paint becomes a Core Web Vital on March 12”, https://web.dev/blog/inp-cwv-march-12
- web.dev, “Largest Contentful Paint (LCP)”, https://web.dev/articles/lcp
- web.dev, “Optimize Largest Contentful Paint”, https://web.dev/articles/optimize-lcp
- #performance
- #core-web-vitals
- #lcp
- #lighthouse
Written by Parsa Alizadeh
I build web and mobile products end to end, and the AI tools that make them smarter. I care about fast interfaces, clean systems and shipping.